- Nitrogen (N) and sulfur (S) are key elements for protein synthesis in soybeans.
- Supplemental sulfur application was observed to impact measured yields at locations with low soil pH.
- Growing environment and variety selection affected protein and oil content more than sulfur.
IntroductionSoybeans are a high protein grain that is processed for oil and commonly used in animal feed. The high level of protein and energy supplied from soybean meal is an essential feed component in livestock production. With an increasing global population, the need for economical and efficient sources of protein in animal agriculture will continue to grow, as well.
1 While soybeans are an adequate protein source, increasing the nutritional feed value of soybeans could be useful in meeting the rising demand for protein in livestock production.
- S is absorbed by plant roots in the sulfate form.
- S deficiency symptoms in soybeans appear as chlorosis in younger plant leaves due to limited ability to remobilize in the plant.2
- One of the roles of S in the plant is storing energy and making energy transfer easier.
- The protein synthesis process in plants depends on both N and S.
- Sulfur is a component of proteins and certain amino acids in soybeans.
One of the goals of this study was to determine if supplementing sulfur fertilizer could alter grain yield and protein content in selected soybean varieties.
 Materials and Methods
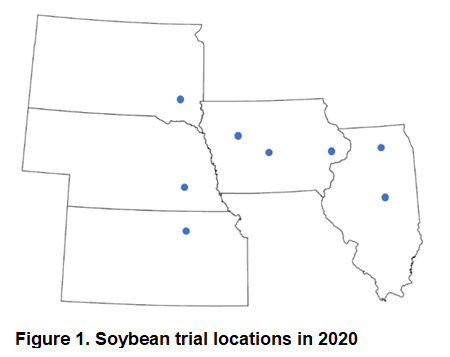
Trials were established at 8 locations across IL, IA, SD and NE to understand the effects of different sulfur-containing fertilizers on soybean yield and protein content (Figure 1). To understand if soybean yield and composition responses to sulfur are similar, or if varieties respond differently to supplemental sulfur, multiple varieties were chosen.
6 soybean varieties were selected within either a 2.2-2.7 RM or 2.9-3.5 RM range and planted at 5 and 3 locations respectively, wherever best fit that maturity zone. Within each location, 3 different forms of S were applied to all varieties shortly after emergence for comparison to the control treatments which did not receive sulfur. Each combination of variety and sulfur was repeated 3 times within each location. 2 of the applied sulfur sources, ammonium sulfate (AMS) and calcium sulfate, were in the form of sulfate and the third source, Mosaic MicroEssentials® S10® (MES 10), delivered equal parts of sulfate and elemental sulfur. Rates of ammonium sulfate fertilizer (21-0-0-24 S), pelletized gypsum (14% S) and MES 10 (10% S) were applied to deliver a 25 lb/A sulfur rate to selected treatment strips.
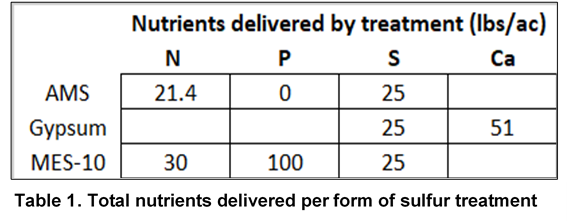
As a result of standardizing S rates across forms, some treatments received additional nutrients (Table 1). Applications were made using a calibrated spinner spreader to deliver the desired rate of each fertilizer shortly after planting. Like nitrate, S is relatively mobile in the soil. With fertilizer being applied prior to crop emergence, rainfall was relied on to incorporate fertilizer into the soil. Plots were harvested with a research combine at maturity, and grain yield and moisture were collected at the time of harvest.
 Discussion
There was consistently a lack of yield response to sulfur through the form of gypsum across all locations (Graph 1). However, there were small, insignificant responses from AMS and MES 10 applications at most of the locations. Seward, NE, had a 4.7 bu/A response to MES 10 and was the only site in which the responses were significantly greater than unfertilized check plots. The second largest response resulted IA AMS applications at the Cedar Rapids, IA, site. Slater, Iowa, had the third largest response to S treatments, and combined with Seward, shared a commonality of both sites having lower soil pH values of 5.4 and 5.8, respectively.
Availability of sulfur tends to decline with lower soil pH levels, making yield responses from supplemental sulfur applications more likely at these sites. There were yield differences between individual varieties within and across sites. However, sulfur response was fairly consistent across varieties within a location.
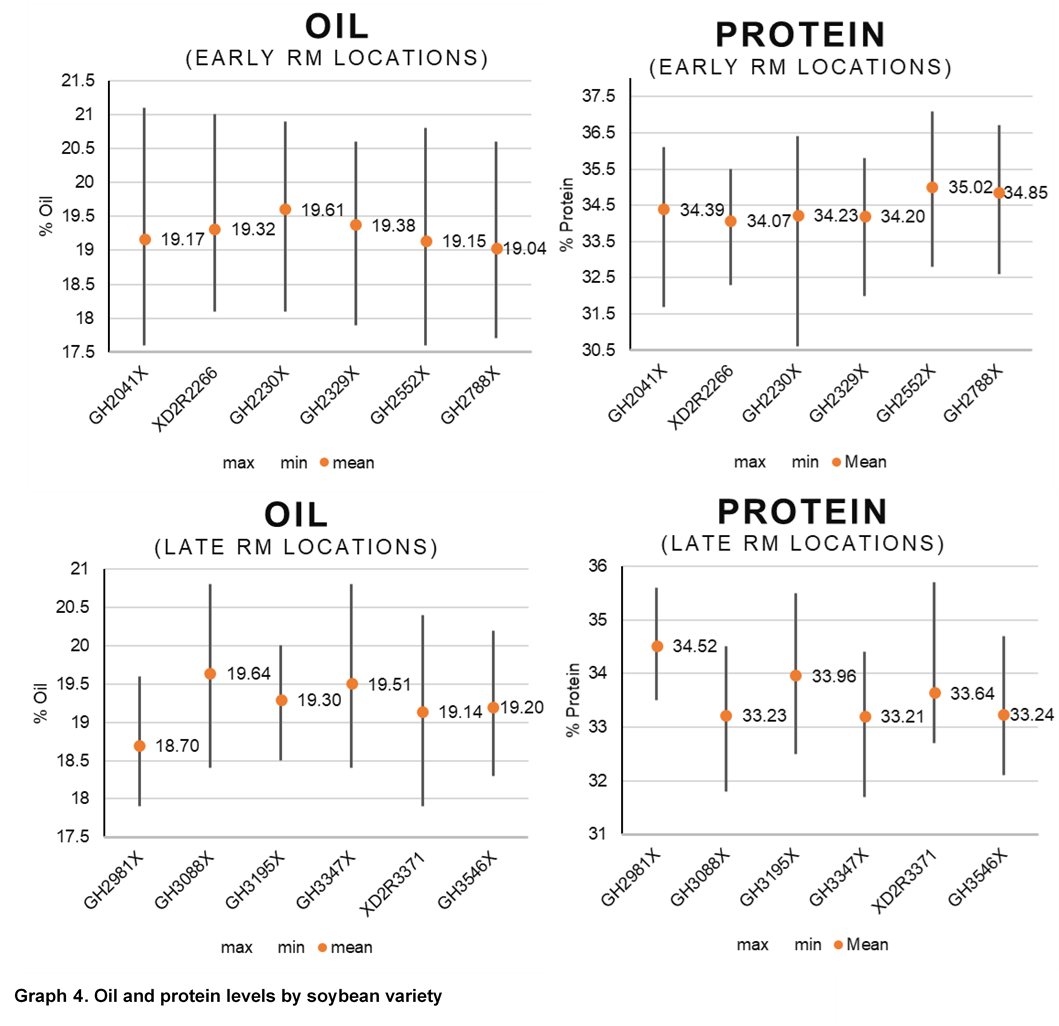
Due to the role of S in protein production, grain samples were also collected for all varieties and sulfur treatments and were analyzed using near-infrared (NIR) spectroscopy to understand oil and protein differences. Increases in protein levels from sulfur were only observed at the Cedar Rapids location and occurred with all 3 forms of sulfur application. Protein levels were more consistently influenced from soybean variety and growing environment (Graphs 2 and 4).
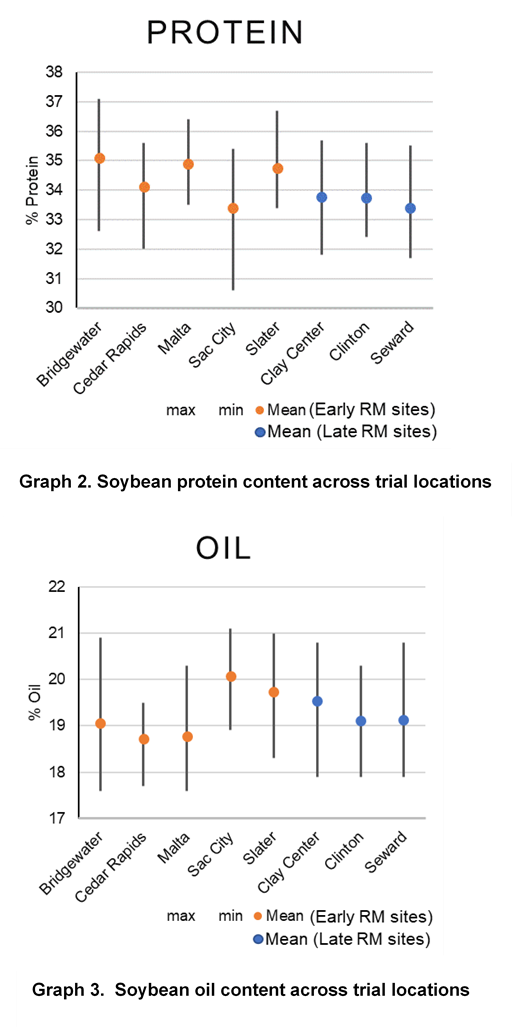
Oil content had small increases or decreases depending on location. There were levels of variation by location as to source of sulfur, resulting in changes to oil level. No consistent trend was observed for oil when compared across locations. Similar to protein, variety selection and growing environment had more influence on oil content than sulfur applications (Graphs 3 and 4). Previous studies have shown changes in soybean protein or oil content due to management sometimes result in reduced oil levels with protein level increases. In this study, there were several locations and soybean varieties that similarly showed that as protein or oil increased, the other decreased (Graphs 2 and 3).
S deficiency is becoming more common in crop production today. As environmental emissions of S continue to be cleaned up, mitigation of deficiency is becoming more apparent. Soil tests can be used to evaluate soil sulfur levels, but no response thresholds have been established for interpreting results. Because S is mobile in the soil, test results could over- or underestimate S levels with variation in the amount of sulfate that has moved through the soil profile compared to sampling depth.
Testing methods can vary between labs, but ideally S levels will fall in the 10-20 ppm range. Fertilizers in the sulfate form are more readily available to plants compared to elemental S. which must first be converted to the sulfate form before becoming available to plants. Plant tissue sampling is helpful in determining in-season sulfur deficiency and is more accurate in determining sulfur needs that require immediate correction. Monitoring soil S levels through soil testing and utilizing plant tissue sampling to identify and correct deficiencies can ensure plants have adequate sulfur throughout the growing season.
For more information on soybean S management, contact your local
Golden Harvest Seed Advisor.
Photos are either the property of Syngenta or used under agreement.
Syngenta hereby disclaims liability for third-party websites. References:
1Krishnan, H. 2008. Improving the Sulfur-Containing Amino Acids of Soybean to Enhance it Nutritional Value in Animal Feed. Jez, J. ed. Sulfur: A Missing Link between Soils, Crops, and Nutrition. Agronomy Monograph 50: 235-249.
2Taiz, L., E. Zieger, I.M. Moller, and A. Murphy. 2014. Plant Physiology and Development. 6th Ed. Sinauer Associates, Oxford University Press.